As I have mentioned in my previous article about spreadsheet tips ("
Spreadsheet Tips (1): More Flexible MOP Template"), you don't need to be an Excel expert or having a blackbelt in VBA in using the tips I have shared. In fact, the more "sophisticated" your spreadsheet is, the higher possibility your spreadsheet will drive your life into misery.
In this article, I will share some simple rules in formatting your spreadsheet and structuring your spreadsheets. Oops, am I refraining you from becoming Picasso or Van Gogh in your office?
Tip (1): Apply Standard Rules of Formatting
One of the best ways to make your spreadsheets more efficient is to apply standard formatting rules when you setup a spreadsheet template. Why? By having standard formatting rules, you don't need to spend time to figure out which colors / border style / font face & size will make your spreadsheet nicer. Also, you don't need to have headache anymore when you need to combine spreadsheets from different team members. Just follow the standard rules, and your spreadsheets will definitely look neat & professional.
When I leaded a team previously, I strictly demanded my team members to follow the formatting rules as closer as possible. Yes, my members found out the rules might appear too stringent at the first place, but once they got familiar to the rules, they found out they can setup spreadsheet templates quicker without worrying about the formatting.
Let me share with you the formatting rules I have:
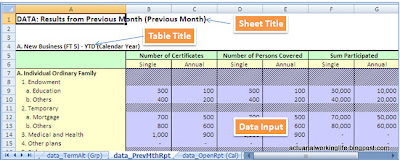 |
| Figure 1: Color Sheet |
- Color Sheet / B&W Sheet: Those sheets to be printed out as hardcopy reports should all be B&W, and cell shading using color should be minimized. Why? Because most reports are printed using B&W printers, cell shading using color will only smear your reports and waste printer toner. For other sheets which are used for working, it is OK to use color as cell shading.
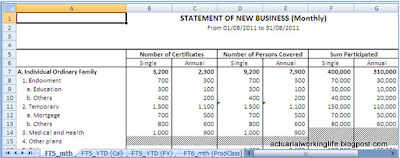 |
| Figure 2: B&W Sheet |
- Font face / size: Use only ONE type of font face, normally we should use the default font face defined by Excel (such as "Arial" or "Calibri"). We should try to maintain the same font size throughout the entire spreadsheets, except sheet title. Frankly speaking, having many font faces in your spreadsheets will make them look ugly (especially you mix "Arial" with "Times New Roman").
- Sheet Title: Every sheet should have its own title, so that by reading the title, we immediately know what it is about. In the early years when I started my actuarial career, my appointed actuary emphasized "title" very clearly: "How do I know what the worksheets are if you do not put any title?" It's so true, without a title, the reader/user need to "guess" the contents and the "guess" may be wrong!
- Cell shading: We should apply a specific shading for cells which require use inputs, so that we know exactly which cells we need to key in values. For example, the input cells in my spreadsheets are with color shading in purple. In case you need to protect your spreadsheets, you can easily identify those cells which you need to "unlock" (as a good practice, spreadsheet templates should be protected to avoid intentional/unintentional alteration to the templates).
- Table header: I also use specific color scheme for table headers, mainly apple green & light yellow (you can refer to the example in the above image). In case there is three-layer table header, I will use sky blue at the third layer (rarely have such table). Try to use soft color, avoiding creating additional stress to your eyes.
- Table border: I normally use thicker border to outline table, and thin border for inside border. You don't need to have borders for every row of your table, as this will make your table looks complicated and difficult to read.
- Date & File name / sheet name: For those sheets which you need to print out as hardcopy reports, please remember to put (1) (automated system) date & time and (2) file name / sheet name at the header/footer. This will be particularly helpful especially if you have multiple versions of reports for your boss's review. (OK, your guess is right, long time ago I was scolded by my boss once as he couldn't identify which version was the latest one as all versions looked almost the same except the figures...)
Tip (2): Put Your Data & Formulas at the Correct Place
Generally, many actuarial exercises can be summarized as 3-step process below:
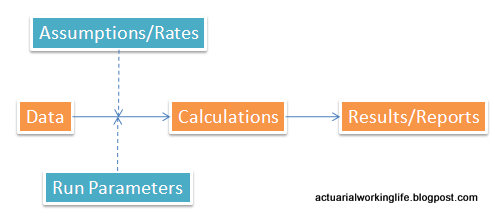 |
| Figure 3: General Workflow for Actuarial Exercises |
- Data: The major input of the actuarial calculation, such as policy data.
- Calculation: Together with the "Assumptions/Rates" and "Run Parameters" (e.g. valuation date), the "Data" are input to the actuarial models to perform "Calculations" based on the pre-defined methodologies/formulas.
- Results/Reports: The "Results" produced by "Calculations" are then compiled into "Reports" for the target readers (e.g. the Management).
Actually, we can apply similar concept in setting up a spreadsheet template - i.e. having "mini" 3-step process in the spreadsheet. By segregating individual sheets in the spreadsheet properly according to its "roles", your template will become more organized and easy to manage:
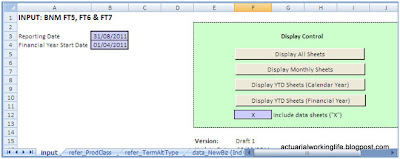 |
| Figure 4: "Input" Sheet |
- "Input" sheet: corresponding to the "Run Parameters". In this sheet, you can define the valuation/reporting date and some other parameters/controls.
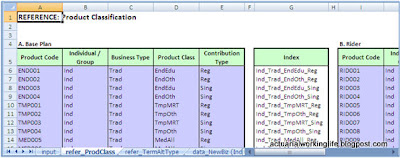 |
| Figure 5: "refer_*" Sheet |
- "refer_*" sheet: corresponding to the "Assumptions/Rates". Of course, this doesn't limit to assumptions or rates only - in the given example, I use "refer_ProdClass" sheet to define the product grouping for each product code.
- "data_*" sheet: as meant the sheet name, this corresponds to "Data". In the given example, I will include the result summary produced by other tools (such as FoxPro) in this sheet (Of course, I will paste value at the purple cells only).
- "Calc_*" sheet: corresponding to "Calculation". Sometimes, we will combine "Calculation" and "Results/Report" together - just like the template I used in this article, it doesn't have any separate calculation sheet. NO input cell in this sheet.
- "FT5_mth" sheet etc.: corresponding to "Results/Reports". This sheet will be printed out as report. NO input cell in this sheet.
Hopefully the above tips are able to help you to make your spreadsheet template more efficient. In case you require any further clarification, feel free to let me know and I will try my best to help.
You may refer to the following articles for more spreadsheet tips:


Comments
Post a Comment