Sunday, October 14, 2012

Less Checking, More Correction

This morning when I went through parts of my actuarial study notes on modeling, I came across this statement:

"The modeling process often has a demanding deadline and a temptation could arise to accept the results from the model without performing a rigorous validation process. It is imperative that sufficient time be allotted to validating the model and subsequently reconciling the model results to emerging results."

This statement has rightfully highlighted the importance of validating & reconciliation exercises during modeling process - in fact, this statement is also true for other actuarial works as well as system implementation. Theoretically, we know that we should allocate adequate amount of time & resources to check/validate the model/process we have built up and reconcile the results the model/process has produced. Unfortunately, in real life, not many of us do what the statement has suggested in practice.

"We have to forego vigorous checking & validation due to tight deadline" - does this statement sound familiar to you? Yes, time constraint always appear as one of the major reasons (or excuses?) of not doing adequate checking & validation exercises, which are always viewed as unpleasant burdens that do not benefit the entire project much - sometimes, these exercises may be viewed as obstacles to deter from completing a project (especially when the project is significantly over-due). To make the matter worse, when the management starts to get uneasy with the project implementation team ("PIT") for missing deadlines or reporting recurring issues, the management's pressure will "encourage" the PIT to sweep the potential issues under the carpet so that they can can report good news to the management - to suppress the potential issues from emerging to the surface during the project timeline, PIT will definitely cut the amount of checking & validation to be done (how on earth we can we detect a problem if we do not carry out checking & validation?).


Unfortunately, the less checking & validation work we do during the project timeline, the more corrections we are going to do in the future. "Never mind, we can do enhancements later and schedule as parts of Day-2 exercise" - ehhmm, I don't mean to harsh, but are you sure that the "Day-2 exercise" will ever come? As what I have learned from some articles on Deming Cycle around 5 years ago (Manager Today, ISSN 18132391, May 2007 Issue), corrections are always much difficult comparing to do things correctly at the first place. Try to imagine if we promote the unit creation & deduction process which contains errors to production, how much efforts & resources to be put in do rectify the erratic data generated in the policy admin system? How many stakeholders will be affected by the errors which by right can be detected earlier? Unless we perform a thorough checking & validation exercise, we will not know how we rectify the error we encounter today will cause another error tomorrow.

Of course, we should not over do checking & validation until it becomes too tedious and consumes too much resources that we should spare for other work. In short, we should strike a balance between theory and practical.

Thursday, October 11, 2012

Do We Have Less Business Sense?

After completing my Prophet training yesterday, I met someone from another department (i.e. not Actuarial Department) and had a short chat with him. During our conversation, we briefly touched on the work Actuarial is doing (more specifically Actuarial Department in an insurance company).

Mr. L commented that Actuarial's work is too specific in their own technical area, and they do not see the business from wider angle compared to another department (well, this was considered a polite way to say "having less business sense..."). Actually I wasn't surprise to hear this comment, however I didn't agree with this perception. "Actuarial have involvements in many areas of an insurance company - based on my experience, I know Actuarial does involve in areas like finance, underwriting, claim, operations and ..."

Although I don't agree with what Mr. L has commented, I do observe some of us who working in Actuarial fields limit ourselves to so-called "actuarial work" only, and don't participate actively in business processes which involve other departments. "It's not our job" or "we are too busy" may be the popular excuses used to not participating in those business processes. Sadly, this has created an incorrect impression or perception among people from other fields that "Actuarial people" are merely reserve calculator and report compiler who work on their own island. Yes, THIS IS NOT TRUE, but unfortunately this is how some people from other fields do think.

Until now I still think that the concept instilled by one of my previous superiors is very correct. "Go to Claim Department and get more understanding on the medical claim!" When I was carrying out experience studies (such as loss ratio analysis on medical products and morbidity study on dread disease) during the early years of my actuarial career, I was "instructed" by my superior to talk to Claim Department so that I can get a better feel and understanding on how insurance benefits are processed and paid. I still remember that I brought a few manual death registers (which were used before the claims were fully processed in the system) back to the Actuarial Department to go through - and I was "scolded" by some of my colleagues for bring such "inauspicious" things to the departments! Due to better understanding and relationship with Claim Department, the critical messages & observations from my experience studies were successfully conveyed to them and some measures was taken to control the claims.

If we want to improve how other people see us, perhaps we should first change how we see ourselves. What we are doing not only impacts ourselves, but also influences how other people see others who are working in the actuarial field as well.

Tuesday, August 14, 2012

Business Knowledge is Most Important

"Mr. P is now having some hard time dealing with policy data... Last time he just used the data which were already cleaned up and formatted by Mr. C. Anyway, this is good for him." Ms. L told me so during our coversation when we had lunch together yesterday. She is my ex actuarial colleague who I have known for ten years (and she is now a "mom-to-be"!)

"Yup, this is definitely a good thing for him to learn. Now he can get to the real picture of policy admin system." I agreed with Ms. Lee. Mr. P is my ex-colleague as well, however he is a few years junior than us.

"Actually almost all companies have some extents of system issues."

"Yes, I agree. I think that most problems because the persons who setup system do not have enough knowledge on how the business should work."

After dealing with several policy admin systems at different insurance/takaful companies, I find out that lack of business knowledge is the key reason causing most critical system issues. If the person who develops system doesn't understand how actually the business should work, how can we expect the system will work correctly? To make matters worse, many system implementation projects are run on unreasonably tight timeline until many non-sales functionalities (e.g. Claim module) will have to sacrify - always be scheduled as "Day-2", but the problem is my claim friends totally have no idea when will the "Day-2" comes...

Sometimes, the business owners themselves don't realize that they are not equipped with the relevant business knowledge - for example, incorrct perceptions on family takaful products with participant account ("PA"). When we talk about family takaful products, many of us with conventional life insurance background may say: "Easy lah, these poducts work the same way as conventional investment-linked products, nothing special..."  It is "hopefully" the same, but unfortunately it is NOT. The unique treatments on PA profit declaration alone (will double up if the products are will durplus sharing) can cause a disaster to the system if the conventional investment-linked modules are duplicated for these family takaful products. To make the matter worse, some business owners may come out with so-called "creative" shortcut solutions to overcome the problems they encounter - which will cause more problems like a snowball rolling.

Perhaps it is high time to revisit how Business Analyst ("BA") should play their roles effectively in the system implementation projects. If the responsible BAs are mainly from IT background, I would recommend the respective business owner to get a dedicated actuarial support to serve as the "intermediary" to facilitate communications from both technical and non-technical - as they talk different language! How do I know this? Well, it is because I was the "intermediary" in one of my previous consultancy work...

Wednesday, June 20, 2012

Spreadsheet Tips (4): Use Excel to Write Excel Formula

In my previous article, I share some tips on how to use Excel to write FoxPro SQL coding ("FoxPro Tips (1): Use Excel to Write Your Codes"); in this article, I will share another tip of using Excel to write coding - but this time is for writing formula in Excel spreadsheet itself! You may find out some tedious formula can actually be written in a very quick & simple way.

Let me share with you real case study. One of the exercises I have completed with my client recently was checking Prophet model point files ("MPF") produced from a new tool - to find out if there are any differences from the existing MPF:

STEP 1: Import MPF into Excel

Figure 1: New MPF data (labeled as "data1")
Figure 2: Existing MPF data (labeled as "data2")

To compare new and existing MPF, import the MPF into Excel (note: MPF are in comma delimited format) and organize the data as per Figure 1 & 2 below. If you examine "data1" sheet and "data2" sheet carefully, you will find out that the field sequences for these 2 sets of MPF are different. For example, the first field of Sheet "data1" is "Field1", whereas for Sheet "data2" is "Field2".

STEP 2: Setup Comparison Sheet

Figure 3: Copy "data1" Field Header to Sheet "Compare"

Insert a new sheet and rename it to "compare". Copy the field headers from Sheet "data1" and paste them in Row 5, as shown in Figure 3 (you can use field headers from Sheet "data2" if you would like to make Sheet "data2" as the comparison base).

Figure 4: Copy "data1" Field Header to Sheet "Compare"


Copy the field headers from Sheet "data2" and paste them in Row 1. Below each Sheet "data2" field header, key in the column name (A, B, C, ... either upper case or lower case), as shown in Figure 4. The labels in Row 2 represent the column name for Sheet "data2" field headers.

Figure 5: Look-up column name for Sheet "data2" field headers

In row 3, use HLOOKUP to look-up the column name from "data2" sheet for the corresponding field name stated in row 5. For example, the formula input in Cell A3 is "=HLOOKUP(A5,$A$1:$AI$2,2,FALSE". Sounds a bit confusing? Well, the "c" in Figure 5 above means that "Field1" is located in Column C in Sheet "data2".

STEP 3: Build Excel Formula

Figure 6: Compare the first record of Field 1

In Cell A6, compare the value of first record of Field 1 - if the values are the same for both Sheet "data1" and Sheet "data2", return 0 as cell value (and 1 vice versa). You can do the comparison in the normal way you use Excel - for example, the formula you will create in Cell A6 is "=IF(data1!A2=data2!C2,0,1)".

Figure 7: Build Excel formula

Instead of showing "0" in Cell A6, now you are going to change value to "=IF(data1!A2=data2!C2,0,1)" as shown in Figure 7. How? Let me share with you the most important trick of this article - you change the formula to '="=IF(data1!"&A2&"2=data2!"&A3&"2,0,1)"' and cell A6 will have the the value as shown above.

Figure 8: Copy and paste value the formula built

Copy Cell A6 and paste in Row 6 for all column with field headers in Row 5. Copy all cells with formula in Row 6 and paste value. Now the formula in Cell A6 has been converted from '="=IF(data1!"&A2&"2=data2!"&A3&"2,0,1)"' to "=IF(data1!A2=data2!C2,0,1)". But why Cell A6 doesn't show "0" instead? Don't worry, you need to do one more step to get Cell A6 showing "0".

Figure 9: Convert Excel formula


If you configured your Excel for Prophet previously, you can use "Refresh" found in "Add-Ins" tab. Otherwise, you can press F2 and followed by Enter for each cell in Row 2 to convert the "written" formula to "real" formula, as shown in Figure 9 above.


STEP 4: Copy Formula to Remaining Cells

Figure 10: Complete Comparisons

Copy Row 2 and paste in the remaining rows below Row 6 (as per no. of records of Sheet "data1"). Normally, it is recommended to add a total in Row 4 so that you will know which field contains inconsistent values. Conditional formatting is a good way to indicate which field have 1 or more records with different values.

Tuesday, May 22, 2012

FoxPro Tips (1): Use Excel to Write Your Codes

Figure 1: File Layout for a Source Text File
Do you ever think of using Excel or other spreadsheet application to help you to write your FoxPro program? Yes, when you need to write a set of tedious coding, you may find out Excel may be a great helper to you.

For example, in order to convert a source text file into DBF format, I need to create a table structure based on the file layout of the text file (just like Figure 1). However, the problem is the text file consists of 200+ fields - I would definitely look stupid if I copy the field names & field properties one-by-one into the SQL coding.

Your guess is right, I completed the relevant coding (CREATE TABLE (Field1 C(1),Field2 C(8),...)) within a few minutes by using Excel. Let me share with you how I did the coding:

STEP 1: Copy the file layout to Excel
Figure 2: Copy file layout to Excel
I copied field name, field type and field width from file layout Word document and pasted value into Excel. Of course, in order to do so, you need to first ensure that your file layout consists of the following info and is organized as per the format needed.

STEP 2: Build SQL coding for individual fields
Figure 3: Build SQL coding for individual fields 
Now I used the magic operator "&" to write SQL coding for each individual field, which I was going to include in the bracket after CREATE TABLE - should be in Fieldname FieldType(Field Width)  format. The formula I entered in cell E1 was:

=A1&LEFT(B1,1)&" ("&C1&")"

Then I copied and pasted the formula for other cells. You can see the formula and results as per Figure 3.


STEP 4: Combine coding for individual fields

Figure 4: Combine coding for individual fields (10 fields per line)
As it would be too long if I place the coding for all individual fields in a single row, I decided to break the coding into several lines - each line consists of the coding for 10 fields. After the end of the10th field of each line, I need to add an ";" in order to break the coding into the next line. The formula I entered in cell H2 was:

=IF(F2=1,"",H1)&E2&","&IF(F2=10,";","")

In column F, I included counters from 1 to 10 repetitively - in order to identify the first line & last line. Then I copied and pasted the formula for other cells.

STEP 4: Filter rows with counter = 10

Figure 5: Filter rows with counter = 10
I filtered the counter column by selecting only the row with counter = 10. I copied the cells in column H and pasted directly to my FoxPro program. Of course, as the counter for my last row of coding was not equal to 10, I manually copied the last row of coding and pasted into my FoxPro program.

Does it look easy to use this tip? Do practice more and you will become more familiar in making Excel as your little programming helper. Actually, you can use Excel to write Excel formula as well - guess how I do it?

Wednesday, April 11, 2012

Spreadsheet Tips (3): How to Create a Spreadsheet Template?

"Do you agree that spreadsheets cannot be separated from actuarial life?" Yes, I totally agree without any doubt - almost all actuarial exercises that I know involve spreadsheets, especially MS Excel. I even heard a actuarial joke before teasing actuaries: "An actuary is a person who creates complicated spreadsheet".

Tips (1): Simple Rules for Good Spreadsheet Templates
Well, actually I don't quite agree with this actuarial joke. I admit that I have few spreadsheet templates that are complicated, but many spreadsheet templates I created before are actually pretty simple (despite the number sheets). Why should we create a complicated spreadsheet template if we can use a simpler way to do our work? I used to advise my ex-team members previously to follow some simple rules when creating their spreadsheet templates:
  • Avoid advanced Excel formulas if possible - you can do most of your jobs using common Excel formulas (such as SUM, SUMIF, SUMPRODUCT, COUNTIF, VLOOKUP, HLOOKUP, ...). Please do not use arrays if possible as they will make checking work very difficult (please don't expect anyone to go through all formulas one-by-one...).
     
  • Minimize VBA - if a calculation can be done easily by just using common Excel formulas, NO macros/VBA please.... As macros/VBA involves coding, it takes time for the users to understandand it may not be easy to modify, especially for an entry level actuarial executive. In my view, you should try to avoid macros/VBA unless your calculation require repetitive computation jobs (such as extracting Prophet results for 25 runs), or you need to automate some non-calculation tasks (such as creating various "paste value version" of reports for finance).
     
  • Use standard formatting - As I share in my previous article on spreadsheet tips ("Spreadsheet Tips (2): How to Structure Your Spreadsheet?"), by having standard formatting rules, you don't need to spend time to figure out which colors / border style / font face & size will make your spreadsheet nicer. You can save your efforts for other more "productive" work.
     
  • Organize tables systematically - normally, a spreadsheet template is formed by many tables - your spreadsheet templates will be organized if you organize the tables systematically. One of the simple ways to try to organize tables is to place your tables "from up to down" (vertically) if possible, instead of "from left to right" (horizontally) or both (i.e. "vertically" and "horizontally" at the same time). However, tables with many rows (such as mortality tables) are more suitable to be placed side by side as they are too long.
Figure 1: Organize Tables "Vertically"

Figure 2: Bad Example of Organizing Tables


Tips (2): Simple Steps in Creating Spreadsheet Templates
Creating spreadsheet templates is usually part of the exercise to setup an actuarial processing. After getting your approach paper (i.e. document that outlines the methodology of your actuarial study) ready, you can start to create your spreadsheet template:

Figure 3: Suggested Steps for Creating a Spreadsheet Template

  • Step 1: Plan Your Spreadsheet
    Think how you want your spreadsheet template to be, based on the methodology outlined in the approach paper. For example, you may need to decide whether you want to have monthly report and YTD (year-to-date) report for you new business analysis.
     
  • Step 2: Create "Report" Sheets
    After having an idea how your spreadsheet template will look like, you can start with creating the "report" sheets - i.e. those sheets you would like to print out in hardcopies or send to the target readers. At the same time, you may want to create the "input" sheet as well (which you want to place your general parameters such as reporting date) as your "report" sheets may need to use those general parameters.
     
  • Step 3: Create Intermediate Sheets
    Based on the "report" sheets you have created, you can now continue to create the other sheets which helps to translate the data ("input") to the "report" sheets ("results"). You can use some dummy data with specific trends (such as in multiple of 100) to help you to detect errors immediately along setting up those sheets.
     
  • Step 4: Test Your Spreadsheet
    Test your spreadsheet template using dummy data first, followed by the actual data - in case there is any error which you didn't detect previously.
     
  • Step 5: Finalize Your Spreadsheet
    Protect your spreadsheet template if needed. Promote your spreadsheet template to "production" (basically save your spreadsheet template in a designated folder in the actuarial server) and deploy any existing template (move the existing template to another folder which you keep all old templates; please do not delete your old template!) which is no longer needed. Lastly, finalize all necessary documentation. 
If you would like to have an additional reading, perhaps you can to take a look "Spreadsheet Issues: Pitfalls, Best Practices, and Practical Tips", by Mary Pat Campbell (an article from The Actuarial Practice Forum, February 2010)


You may refer to the following articles for more spreadsheet tips:

Tuesday, March 27, 2012

Spreadsheet Tips (2): How to Structure Your Spreadsheet?

As I have mentioned in my previous article about spreadsheet tips ("Spreadsheet Tips (1): More Flexible MOP Template"), you don't need to be an Excel expert or having a blackbelt in VBA in using the tips I have shared. In fact, the more "sophisticated" your spreadsheet is, the higher possibility your spreadsheet will drive your life into misery.

In this article, I will share some simple rules in formatting your spreadsheet and structuring your spreadsheets. Oops, am I refraining you from becoming Picasso or Van Gogh in your office?

Tip (1): Apply Standard Rules of Formatting
One of the best ways to make your spreadsheets more efficient is to apply standard formatting rules when you setup a spreadsheet template. Why? By having standard formatting rules, you don't need to spend time to figure out which colors / border style / font face & size will make your spreadsheet nicer. Also, you don't need to have headache anymore when you need to combine spreadsheets from different team members. Just follow the standard rules, and your spreadsheets will definitely look neat & professional.

When I leaded a team previously, I strictly demanded my team members to follow the formatting rules as closer as possible. Yes, my members found out the rules might appear too stringent at the first place, but once they got familiar to the rules, they found out they can setup spreadsheet templates quicker without worrying about the formatting.

Let me share with you the formatting rules I have:

Figure 1: Color Sheet

  • Color Sheet / B&W Sheet: Those sheets to be printed out as hardcopy reports should all be B&W, and cell shading using color should be minimized. Why? Because most reports are printed using B&W printers, cell shading using color will only smear your reports and waste printer toner. For other sheets which are used for working, it is OK to use color as cell shading.

Figure 2: B&W Sheet

  • Font face / size: Use only ONE type of font face, normally we should use the default font face defined by Excel (such as "Arial" or "Calibri"). We should try to maintain the same font size throughout the entire spreadsheets, except sheet title. Frankly speaking, having many font faces in your spreadsheets will make them look ugly (especially you mix "Arial" with "Times New Roman").
     
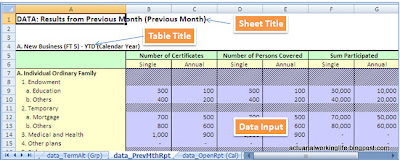
  • Sheet Title: Every sheet should have its own title, so that by reading the title, we immediately know what it is about. In the early years when I started my actuarial career, my appointed actuary emphasized "title" very clearly: "How do I know what the worksheets are if you do not put any title?" It's so true, without a title, the reader/user need to "guess" the contents and the "guess" may be wrong!
     
  • Cell shading: We should apply a specific shading for cells which require use inputs, so that we know exactly which cells we need to key in values. For example, the input cells in my spreadsheets are with color shading in purple. In case you need to protect your spreadsheets, you can easily identify those cells which you need to "unlock" (as a good practice, spreadsheet templates should be protected to avoid intentional/unintentional alteration to the templates).
     
  • Table header: I also use specific color scheme for table headers, mainly apple green & light yellow (you can refer to the example in the above image). In case there is three-layer table header, I will use sky blue at the third layer (rarely have such table). Try to use soft color, avoiding creating additional stress to your eyes.
     
  • Table border: I normally use thicker border to outline table, and thin border for inside border. You don't need to have borders for every row of your table, as this will make your table looks complicated and difficult to read.
     
  • Date & File name / sheet name: For those sheets which you need to print out as hardcopy reports, please remember to put (1) (automated system) date & time and (2) file name / sheet name at the header/footer. This will be particularly helpful especially if you have multiple versions of reports for your boss's review. (OK, your guess is right, long time ago I was scolded by my boss once as he couldn't identify which version was the latest one as all versions looked almost the same except the figures...)


Tip (2): Put Your Data & Formulas at the Correct Place
Generally, many actuarial exercises can be summarized as 3-step process below:

Figure 3: General Workflow for Actuarial Exercises

  • Data: The major input of the actuarial calculation, such as policy data.
     
  • Calculation: Together with the "Assumptions/Rates" and "Run Parameters" (e.g. valuation date), the "Data" are input to the actuarial models to perform "Calculations" based on the pre-defined methodologies/formulas.
     
  • Results/Reports: The "Results" produced by "Calculations" are then compiled into "Reports" for the target readers (e.g. the Management).
Actually, we can apply similar concept in setting up a spreadsheet template - i.e. having "mini" 3-step process in the spreadsheet. By segregating individual sheets in the spreadsheet properly according to its "roles", your template will become more organized and easy to manage:

Figure 4: "Input" Sheet

  • "Input" sheet: corresponding to the "Run Parameters". In this sheet, you can define the valuation/reporting date and some other parameters/controls.
     
Figure 5: "refer_*" Sheet

  • "refer_*" sheet: corresponding to the "Assumptions/Rates". Of course, this doesn't limit to assumptions or rates only - in the given example, I use "refer_ProdClass" sheet to define the product grouping for each product code.
     
  • "data_*" sheet: as meant the sheet name, this corresponds to "Data". In the given example, I will include the result summary produced by other tools (such as FoxPro) in this sheet (Of course, I will paste value at the purple cells only).
     
  • "Calc_*" sheet: corresponding to "Calculation". Sometimes, we will combine "Calculation" and "Results/Report" together - just like the template I used in this article, it doesn't have any separate calculation sheet. NO input cell in this sheet.
     
  • "FT5_mth" sheet etc.: corresponding to "Results/Reports". This sheet will be printed out as report. NO input cell in this sheet.
Hopefully the above tips are able to help you to make your spreadsheet template more efficient. In case you require any further clarification, feel free to let me know and I will try my best to help.


You may refer to the following articles for more spreadsheet tips:

Wednesday, January 11, 2012

New Motor Cover Framework Finally Comes

When I worked with composite insurance companies (i.e. doing both life insurance and general insurance) some years ago, I involved in analyzing claim experience for each product line and calculating IBNR (Incurred but not reported) reserves. Every time I looked at the terrible loss ratio of “Motor (ACT)” and “Motor (Others)” classes, I would pray for the detariff of motor insurance premium rates coming as soon as possible.

I’m glad to hear Bank Negara Malaysia’s (BNM) announcement via its press release on 6 January 2012, revealing the New Motor Cover Framework. According to the press release, the gradual revision in the Motor Tariff premium rates will be implemented effective from 16 January 2012, over a period of four years (2012 to 2015). The Framework will pave the way for detariffing of the motor insurance premiums in 2016, in which premium rates will be further differentiated in accordance to the risk profile of individual vehicles and fairer to vehicle owners as those with good claims experience would enjoy much better premium rates than those with higher risk profile.

Although the detariffing is not implemented immediately, I believe the gradual annual revision will gradually improve the room for general insurance companies to continue to breathe – the existing tariffs has been in place for more than 30 years (such as long time!), which are definitely not reflecting the current experience. Implementing gradual annual revision is a good strategy, which will help to reduce the objections from public and prepare the public for the “true” premium rates of motor insurance. For example, the premium adjustment for a private car of 1,400 cc, will be between RM6.00 - RM34.00 per year, which may looks less burdensome to the public. As motor insurance significantly affects the mass (the level of car ownership in Malaysia is very high – “thanks” to the inefficient public transport), any drastic increase in premium rates will definitely translate to the reputation risk and PR challenge to the insurance companies. Just like health insurance, the insurance companies are easily described as the “bad guy” that “bullies” the “helpless” public.

On the other hand, the detariffing of motor insurance will definitely create additional job opportunities for general insurance actuaries. I can see more and more actuaries with general insurance qualification emerging. Actually this phenomenon also benefits the general insurance industry, by having more general insurance actuaries, the general insurance companies will be able to improve the soundness of product design and management.

Look forward to the first implementation of revised Motor Tariff premium rates on 16 January 2012.


Reference:

Get Inspiration for New Problems

In my last post and debut podcast, I talked about why strong foundations matter for coming up with smart, workable solutions in business. Bu...